


The Story Behind the Glycemic Index
How It Was Discovered and Why It Might Not Work for You

In the 1980s, Dr. David Jenkins and his team at the University of Toronto set out to explore how different carbohydrates affect blood sugar. At the time, carbohydrates were divided into "simple" (like sugars) and "complex" (like starches), but Jenkins’ work proved this distinction was too simplistic. His groundbreaking research led to the creation of the Glycemic Index (GI), a scale that ranks foods based on how much they raise blood sugar levels compared to glucose.
One surprising finding during this research was that certain starchy foods, like white rice, could cause an even higher blood sugar spike than pure sugar itself. This overturned conventional thinking about carbohydrates and revealed that not all starches are "slow-digesting."
How the Glycemic Index is Measured
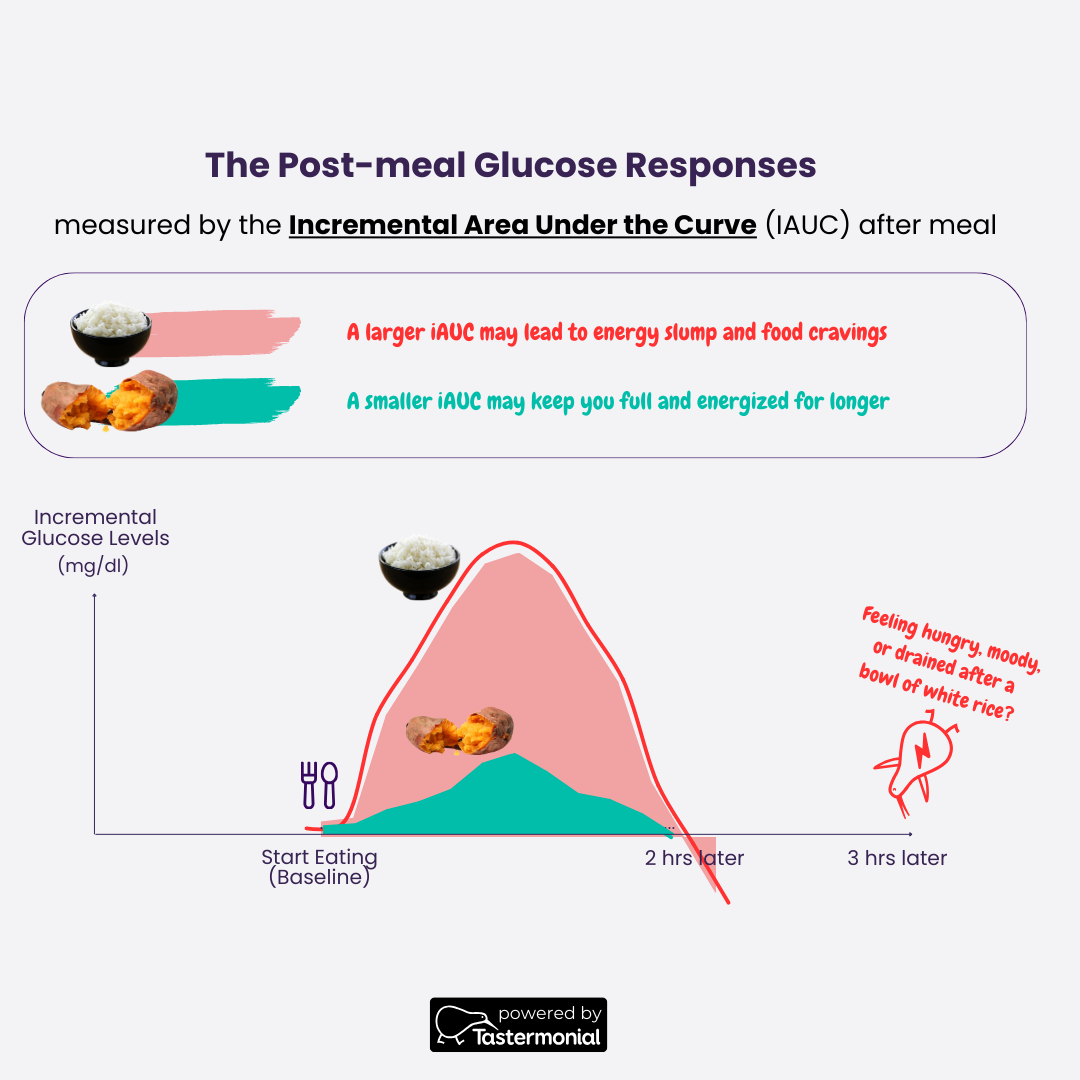
The Glycemic Index measures the impact a food has on blood sugar, but it’s not based on just the spike. Instead, it calculates the total incremental area under the curve (iAUC) of blood sugar levels over two hours after consuming the food. The baseline is the Glucose Level when the test and reference meal is consumed. This total response is a more comprehensive indicator of how your blood sugar behaves, accounting for both the peak and the duration of elevated levels.
Here’s how it works:
Participant Recruitment: Researchers typically recruit 10-12 healthy individuals with normal glucose tolerance.
Consumption of Test Food: Each participant consumes a portion of the test food containing 50 grams of digestible carbohydrates.
Blood Glucose Monitoring: Blood glucose levels are measured at regular intervals for two hours.
Reference Food: On another day, participants consume a reference food—usually 50g of glucose powder dissolved in water—and their blood glucose response is measured again. This reference test is repeated three times to ensure accuracy.
Calculating iAUC: The incremental area under the curve (iAUC) for the test food is calculated, which represents the total rise in blood glucose over time, excluding the fasting baseline levels.
GI Formula: GI value is calculated by comparing the iAUC of the test food to the iAUC of glucose, expressed as a percentage:
\(\text{GI} = \left( \frac{\text{iAUC of Test Food}}{\text{iAUC of Reference Food}} \right) \times 100 \)
For example, if the test food produces an iAUC that is 60% of what the 50g glucose reference produced, its GI would be 60.
The GI scale is categorized as follows:
High GI: 70 and above
Medium GI: 56-69
Low GI: 55 and below
For example, if white rice causes a blood sugar response that is 80% of what glucose does, its GI would be 80. Remarkably, some varieties of rice, particularly short-grain white rice, can have a GI higher than glucose (the reference food), which scores 100.
The Surprising Case of Rice: Why It Can Have a Higher GI Than Sugar
It might seem counterintuitive, but certain types of rice can raise your blood sugar faster and more dramatically than pure table sugar. For instance, short-grain white rice, commonly used in sushi or sticky rice dishes, can have a GI of 90 or higher, which means it raises blood glucose almost as much as glucose itself. This happens because the starch in white rice breaks down very quickly during digestion, leading to rapid glucose absorption.
In contrast, sugar (sucrose) is a combination of glucose and fructose, and because fructose is metabolized differently, it doesn't cause as sharp a rise in blood sugar as pure glucose or rapidly digestible starches like white rice.
What Happens After a Meal: The Blood Sugar Timeline
After consuming a carbohydrate-rich meal, your blood sugar follows a predictable pattern:
Blood Sugar Rise: Blood sugar typically begins to rise within 10-15 minutes after eating. The rise depends on the composition of the meal, with simple carbs or high-GI foods like white rice causing a quicker increase.
Peak Blood Sugar: Blood sugar levels usually peak 30-60 minutes post-meal, though this varies based on the food’s GI, the presence of other macronutrients, and individual metabolism.
Return to Baseline: After peaking, blood sugar gradually declines and typically returns to baseline within 2-3 hours. However, high-GI foods or large meals can delay the return to normal levels, especially for people with insulin resistance or metabolic conditions.
This typical blood sugar curve illustrates why understanding the AUC is critical. A food might not cause a sharp spike but could lead to elevated blood sugar levels that remain high for an extended period, which can still have negative health effects over time.
The Glycemic Index Explained: Why Your Body May Respond Differently
While GI has been an incredibly useful tool, it does have some limitations, especially when considering individual differences and real-world eating habits.
1. It Measures Total Blood Sugar Response, Not Just the Peak
GI values are derived from the total area under the curve (AUC) of blood sugar over time, which means they capture both the spike and the duration of elevated glucose levels. This provides a fuller picture than just focusing on the peak blood sugar level.
2. Personal Responses Vary
Everyone's body processes carbohydrates differently, influenced by factors like the gut microbiome, insulin sensitivity, and overall health. Two people could eat the same portion of rice and have very different blood sugar responses. While the GI provides an average response, it may not fully capture how you will react to a given food.
3. Meals Are More Than Single Foods
The GI is based on single foods eaten in isolation, but we rarely eat that way. Pairing carbohydrates with proteins, fats, or fiber can slow down the digestion process, lowering the total glycemic impact. For example, combining rice with vegetables, healthy fats (like avocado and olive oil), or protein can significantly reduce the overall glycemic response compared to eating rice on its own.
4. Small Sample Size
Most GI tests involve 10-12 participants, which limits the statistical power of the results. A small sample size may not represent the full variability in how different populations respond to food. Individual outliers in such a small group could also skew the average.
Glycemic Load (GL): Bringing Portion Size into the Equation
While the Glycemic Index helps identify how fast carbohydrates raise blood sugar, it doesn’t account for portion size. That’s where Glycemic Load (GL) comes in. Glycemic Load considers both the GI and the amount of carbohydrates in a typical serving of the food, giving you a more realistic view of how much a particular food will affect your blood sugar.
For example, even though watermelon has a high GI, its Glycemic Load is low because it contains very few carbohydrates per serving. Conversely, a bowl of white rice with a high GI and a high carbohydrate content will have a much greater impact on your blood sugar than a small piece of fruit with a similarly high GI.
The Limits of the Glycemic Load
The Glycemic Load (GL) improves upon the Glycemic Index (GI) by factoring in portion size, but it assumes both a correct GI value and a linear relationship between food quantity and blood sugar response. This means GL presumes that eating half the amount of a food will lead to half the glycemic impact, which isn’t always true. The body’s glucose response can be influenced by factors like digestion speed, food combinations, and individual metabolic health, leading to non-linear blood sugar effects.
For example, watermelon has a high GI (~76), but a small serving contains few carbs, giving it a low GL. According to GL, if you eat 50 grams of watermelon and then eat 25 grams, the blood sugar response should be half. However, your body might not follow this simple ratio, as other variables can alter the way glucose is absorbed, meaning the smaller portion might not proportionally reduce the blood sugar spike.
Beyond the Glycemic Index and Glycemic Load: Personalized Glucose Monitoring
Given the variability in how individuals respond to carbohydrates, tools like Continuous Glucose Monitors (CGMs) offer a more personalized approach to understanding the glycemic impact of different foods and meals. Unlike the Glycemic Index (GI), which provides an average estimate, CGMs track real-time blood glucose levels, allowing you to see how your body uniquely reacts to specific foods, meals, or habits like exercise and stress.
CGMs are also a great tool for testing various hacks to reduce post-meal blood sugar spikes, such as adding fiber, consuming apple cider vinegar before meals, taking a mulberry leaf extract supplement, changing the order of your meal (e.g., eating proteins or fats before carbs), or doing light exercise after meals. Each of these strategies can have different effects depending on your individual metabolism, and CGMs help pinpoint what works best for you.
Stabilizing blood sugar offers tangible benefits, including improved energy levels, better mood and mental clarity, fewer cravings, and enhanced weight management. Consistently maintaining stable glucose levels also reduces the risk of long-term health issues like insulin resistance and Type 2 diabetes. By reducing blood sugar "roller coasters" through low glycemic impact foods and tailored strategies, you can enjoy more balanced energy, focus, and long-term wellness.
For practical tips to lower glycemic impact and manage blood sugar spikes, check out the GlucoseGoddess Instagram account. She shares a mix of science-backed hacks based on peer-reviewed publications and anecdotal data from real-world experiments—such as using apple cider vinegar, adding fiber, or changing meal order to reduce blood sugar fluctuations.
Conclusion: Glycemic Index Is Useful, But It Has Limits
The Glycemic Index has helped revolutionize our understanding of how foods affect blood sugar, but it’s important to remember its limitations. GI values represent average responses and are based on single foods eaten in isolation, which may not reflect how most people eat or how they uniquely process carbohydrates. Tools like CGMs can provide a more accurate, personalized picture of how different foods impact your blood sugar.
For more insights into how the Glycemic Index works, watch Dr. Lara Hyde’s video here, where she explains GI in a simple, engaging way.
Have you tried tracking your blood sugar with a Continuous Glucose Monitor (CGM) or noticed surprising results from certain foods? Tastermonial has teamed up with Dr. Lara Hyde, a Nutritional Biochemist and Lecturer at Tufts University, to bring you the latest evidence-based tips on managing your glycemic response.
If you have any questions, feel free to ask by clicking the button below! We’re here to help you better understand your body’s unique response to different foods.
Disclaimer:
The information provided in this blog is for educational purposes only and is not intended as medical advice. Always consult with a healthcare professional before making any dietary changes or trying new supplements. Results from glycemic response and hacks like apple cider vinegar, mulberry leaf extract, or meal order may vary based on individual health conditions and metabolic responses.